
Best Social Media Analytics Tools for Instagram: Choose the Right Analytics Stack
The best Instagram analytics stack matches the workflow gap: use native analytics for content decisions, a management suite for coordinated publishing, a reporting dashboard for recurring exports, and web, CRM, or commerce tools for conversions and revenue. The right choice is the smallest tool category that closes the actual bottleneck.
- Native Instagram analytics for single-account content decisions
- A management suite for multi-account publishing and inbox workflow
- A reporting dashboard for recurring stakeholder reports and exports
- Web, CRM, or commerce tools for tagged conversions and revenue
Choosing an Instagram analytics tool usually starts with a feature comparison and ends with software that cannot answer the question that prompted the search in the first place. The real decision is narrower than a top-ten list suggests: which workflow gap — a single account’s content calls, a multi-account publishing routine, a recurring stakeholder report, or a business-return question — actually needs a tool at all. This guide works through that decision by workflow, shows where native Instagram data and paid dashboards disagree and why, and walks through measuring return on Instagram activity without mistaking engagement for revenue.
Which analytics stack fits your Instagram workflow?
Comparing social media analytics tools makes sense once the question changes from “which is better” to “which workflow gap needs closing.” Four core categories cover nearly every situation an Instagram-focused account runs into, plus one optional add-on for competitive research — and the smallest one that closes the actual gap is the right choice, not the one with the longest feature list. Native Instagram analytics is the first stop for single-account content decisions: what a Reel or carousel earned in reach, views, and engagement, checked inside the app. A management suite earns its place once publishing, approvals, an inbox, or multiple connected accounts create a coordination problem a single dashboard doesn’t solve. A reporting dashboard solves a different problem again — producing the same structured report for people who never log into Instagram themselves — and should be judged on repeatability, not on how many metrics it lists. Web analytics, a CRM, or a commerce platform become necessary the moment the question is about traffic, leads, sales, or return, because Instagram-side engagement cannot answer a business-outcome question on its own. Buying two categories that solve the same bottleneck is the most common overspend in this stack: a reporting dashboard and a management suite both marketed as “analytics” can end up producing the same report with different numbers. The table below separates each option by the bottleneck it actually solves, the decision it supports, what to keep as your own record regardless of which tool you add, and the one thing worth testing before paying for it.
| Workflow bottleneck | Smallest useful tool category | Decision supported | Data source to retain | What to test before adding software |
|---|---|---|---|---|
| Single-account content questions | Native Instagram analytics | What to repeat, adjust, or stop posting | A manual decision log based on records reviewed in native Insights | Whether the native view already answers the question |
| Multi-account publishing, approvals, inbox | Management suite | Whether workflow, not analysis, is the real bottleneck | Publishing calendar and inbox history | Publishing and approval flow in a live trial, apart from its dashboards |
| Recurring stakeholder reporting | Reporting dashboard | Whether the same report can be produced consistently | A saved report template with locked metric definitions | Whether it reconciles against native Insights for one shared period |
| Traffic, leads, sales, or return | Web analytics, CRM, or commerce platform | Whether a campaign produced a business outcome | Tagged campaign links and conversion event logs | Whether a conversion event and value are already defined |
| Market or content hypotheses | Competitor intelligence feature | Whether a specific competitive question needs testing | The public content already visible to you | Whether figures are labeled observed, estimated, or unavailable |
Instagram-native analytics for one-account decisions
Instagram’s own instructions are not perfectly aligned on who can see analytics. One Instagram Help page limits Insights to business or creator accounts, while current account-insights guidance says a public personal or professional account can view them — and switching to private removes that access. The Professional Dashboard is a separate feature available to professional accounts; its visibility conditions aren’t documented as identical to Insights, so confirm your own account’s access rather than assuming one implies the other. Inside the app, the native date-range selector on Insights offers preset and custom windows within the past 90 days; if a public account goes private and then public again inside that window, the same range becomes visible again. Menu names and availability can vary by app version, account type, and region, so confirm your own settings before assuming a feature is missing. For a single account answering “which post worked,” this native view is the first place to check, since it’s the source data itself rather than a downstream copy.
When a management suite earns its place
The “just check Insights” advice stops working once one person is publishing across several accounts, approvals need a paper trail, or comments and DMs pile up faster than one inbox can handle. That is a workflow problem, not an analytics problem, and it is the point where a management suite earns its cost. For example, a marketer coordinating approval for posts across several accounts needs publishing and inbox workflow more than another single-post dashboard. Meta’s own documentation requires the connected Instagram account to be a business or creator account before it can be managed inside Meta Business Suite, and the same account-type condition applies when linking Instagram as a business asset inside Meta’s broader business tools. Buying a suite for its dashboards without testing its publishing and approval flow first is how teams end up paying twice.
Reporting tools solve a repeatability problem
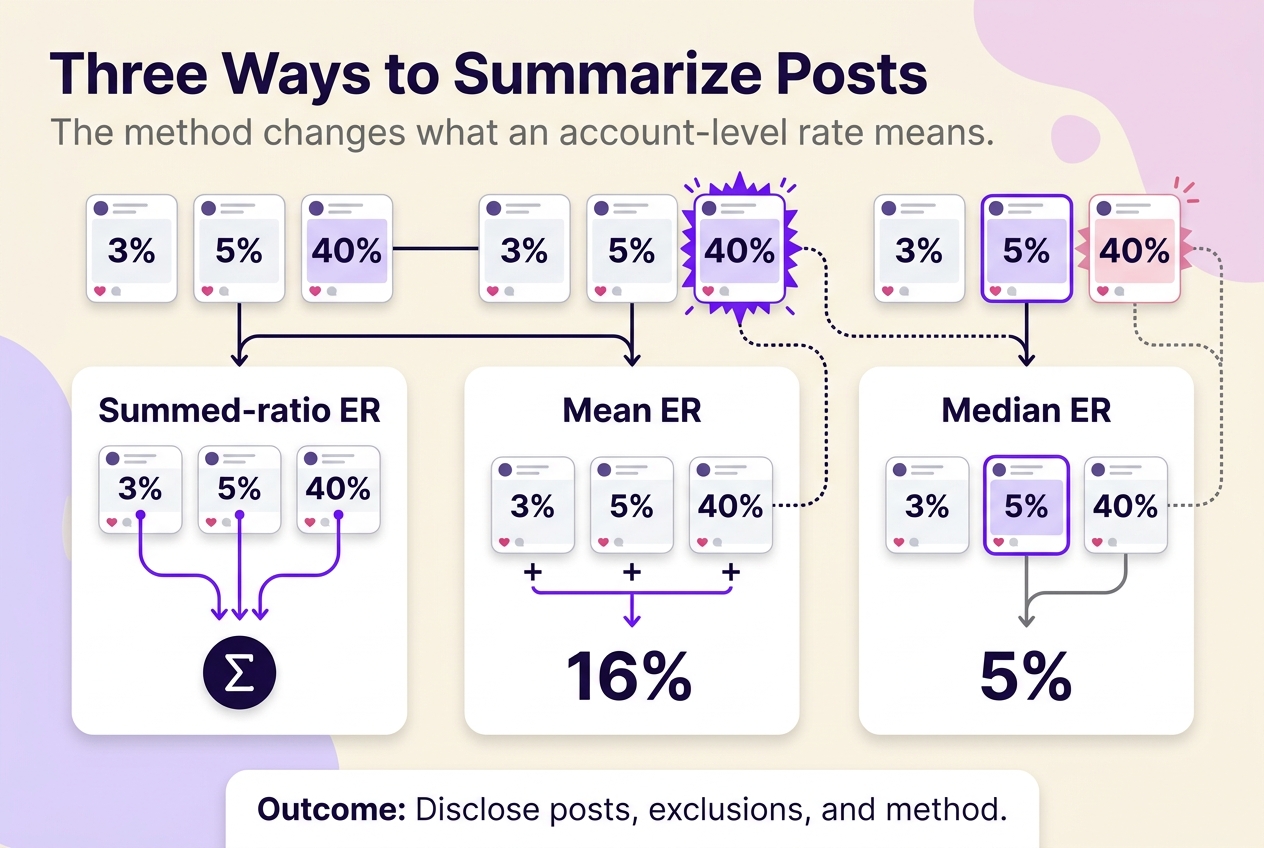
Add a reporting or dashboard tool when the bottleneck is producing the same report every week or month for people who will not log into Instagram themselves — not when the goal is a better single-post answer. Sprout Social, for example, documents an Instagram Business Profiles Report and an Instagram Competitors Report inside its reporting suite, the kind of repeatable structure a dashboard is built for. What it will not do on its own is decide which totals belong in the report or reconcile a mismatch against Instagram’s own numbers; that groundwork happens once, manually, before a report becomes routine.
Web, CRM, and commerce data answer the business-return question
A social click is not a conversion, and no amount of Instagram-side reporting changes that. Once the decision on the table involves tagged visits, leads, sales, or return on spend, measurement has to move off Instagram and into a system built to record outcomes — a web analytics property, a CRM, or a commerce platform. Google Analytics 4 describes attribution as assigning credit for a user action to the touchpoints that preceded it, which is a credit-assignment model, not proof that an Instagram post caused a sale. Email and SMS platforms such as Klaviyo separately define a conversion as an action completed within a set window after a message, and note plainly that their tracking can diverge from a web analytics count of the same customer journey — one more reason to agree on a single system of record before comparing numbers across tools.
Competitor intelligence is optional, not a default purchase
Competitor tracking earns a place in the stack only when a specific, testable market question needs an answer — not as a default add-on. The useful test before buying is whether the vendor labels each competitor figure as directly observed, estimated, or unavailable; Sprout, for instance, markets Instagram competitor and hashtag-trend data as part of its analytics, which is a vendor description of capability, not an independent audit of its coverage or method.
When dashboards disagree, start with the source and scope
The common mistake is assuming a mismatch between Instagram’s own numbers and a connected dashboard means one of them is wrong. More often it means the two are not measuring the same thing. Work the reconciliation in order: same account, same content set, same date range, same metric definition, same reporting time, then organic-versus-paid scope — a difference at any one point produces a different total even when both tools work correctly. Instagram’s native date-range selector operates within the past 90 days, so a dashboard pulling a longer or differently aligned window will not match the same label checked natively for that account. Where several properties are connected as business assets, Meta says a combined view can pull information from all connected assets, which is another reason a rolled-up dashboard total may not match a single-account figure checked directly in the app. Third-party access itself depends on permissions: Meta’s developer documentation ties a connected app’s ability to read insights to the account being linked through a Facebook Page with the right permission granted, and that access is subject to Meta’s general Graph API rate limits. When a mismatch shows up, work back through the reconciliation order above before concluding a tool is wrong — treat the native view as the record to check against, not as an automatic tie-breaker.
A minimum viable analytics stack for small businesses
A practical order for an Instagram-first small business is: confirm the account’s current visibility and settings, then use available native analytics alongside a decision log before spending on anything else; add tagged links and a configured website conversion event next; only then evaluate paid software for a specific, named gap. That order is a judgement call, not a platform requirement — but skipping straight to a paid suite before the tracking underneath it is trustworthy usually means paying for reports nobody can defend in a meeting.
The decision log itself can be a spreadsheet, provided every row records content purpose, format, topic, offer, audience, campaign name, organic-or-paid status, the one outcome metric chosen to judge it by, the date range, and the source it came from. Skip a field and the log stops being comparable within a few weeks, which defeats the reason for keeping it.
Add paid software only when a recurring reporting, collaboration, multi-account, or attribution gap has a named owner and a cost you can justify against what the manual approach is currently costing in time. For broader groundwork on how these measurement decisions fit into a wider account strategy, see our Instagram strategy and analytics resources.
Measure social media ROI from tagged link to financial return
Instagram engagement alone answers nothing about return. Before “ROI” means more than a feeling, a campaign needs a defined outcome, a value attached to that outcome, and a full accounting of what the campaign cost. The workable sequence is: pick one primary business outcome; define its conversion event and the value it carries; apply a consistent campaign identifier to every outbound link tied to the promotion; record every cost that belongs in the calculation, including staff time, creative production, creator fees, media spend, and software; state which attribution assumption is being used to credit the outcome back to the campaign; then calculate (defined return − included cost) ÷ included cost. Attribution here means assigning credit to touchpoints, not proving causation, and that framing matters: the formula produces a number, but the number only means what the attribution assumption says it means. If any step in that chain is missing — no tag, no defined conversion, no recorded cost — the honest answer is that there is not yet enough tracking to calculate ROI, not a number that happens to be small.
Define the outcome, tracking, and cost base
Before any results come in, settle three things in writing. First, the single outcome that counts — a sale, a qualified lead, a booking — because chasing several outcomes at once makes every later report arguable. Second, a consistent campaign identifier applied to every outbound link tied to the promotion from day one; retrofitting names after publication is how otherwise-valid traffic becomes impossible to group reliably. Third, the direct and labor costs that belong in the calculation, agreed with whoever owns the budget, so the return figure cannot be quietly flattered later by leaving a cost out. None of this requires a specific vendor — it requires that whichever web analytics, CRM, or commerce system is already in use has its campaign-tagging and conversion-event settings configured before the campaign runs, not after.
Calculate ROI with illustrative arithmetic
The following figures are illustrative only, not a benchmark or a real case. Say a campaign’s included costs — production, a creator fee, and ad spend — total $1,200, and the tracked, attributed revenue from tagged conversions is $3,000. Using revenue as the return: ($3,000 − $1,200) ÷ $1,200 = 1.5, or a 150% return on included cost. Now swap the return definition to gross profit instead of revenue. For this illustrative calculation, define gross profit as sales revenue minus cost of goods sold, and say that same $3,000 in sales carries $1,800 in cost of goods, leaving $1,200 gross profit: ($1,200 − $1,200) ÷ $1,200 = 0, or no return once product cost is counted. Same campaign, same arithmetic, a different business question — which is why the return definition needs agreement before the number gets reported, not after.
Match each metric to the decision it can support
Not every Instagram number answers the same question, and treating them as interchangeable is how “best post” conclusions fall apart. Use on-platform distribution and engagement measures — reach, views, likes, comments, shares, saves — for content-learning decisions: what to repeat, adjust, or stop making. Use tagged traffic for site-interest decisions: whether a specific piece of content is worth sending people somewhere else at all. Use conversions plus an agreed value for commercial decisions: whether a campaign is worth its cost, a separate question from whether it got attention.
The common failure is comparing posts that differ on more than one variable at once. If one Reel used a trending audio track and a giveaway offer while another used original audio and no offer, a gap in engagement cannot be credited to the audio alone — format, offer, audience, campaign purpose, and paid support are all mixed together, and isolating one of them is the only way the comparison teaches you anything repeatable.
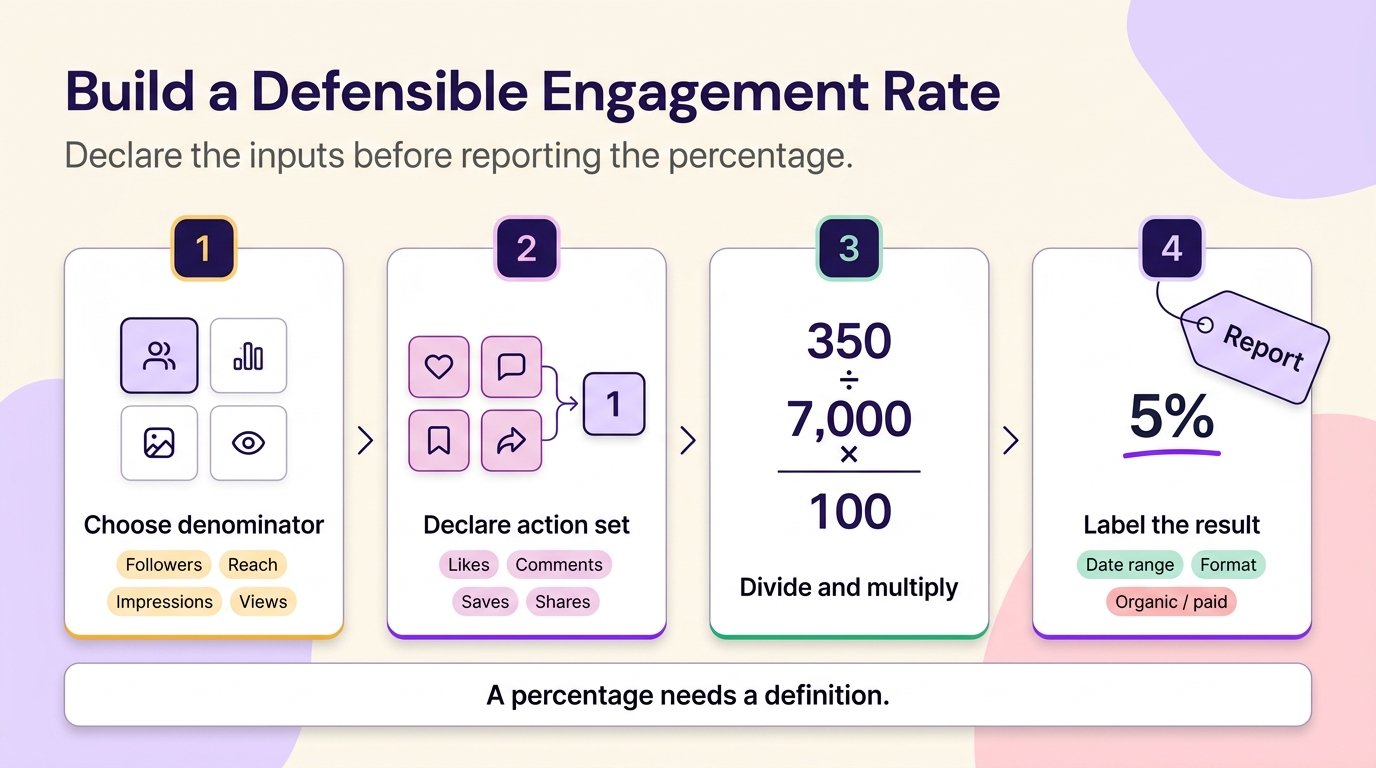
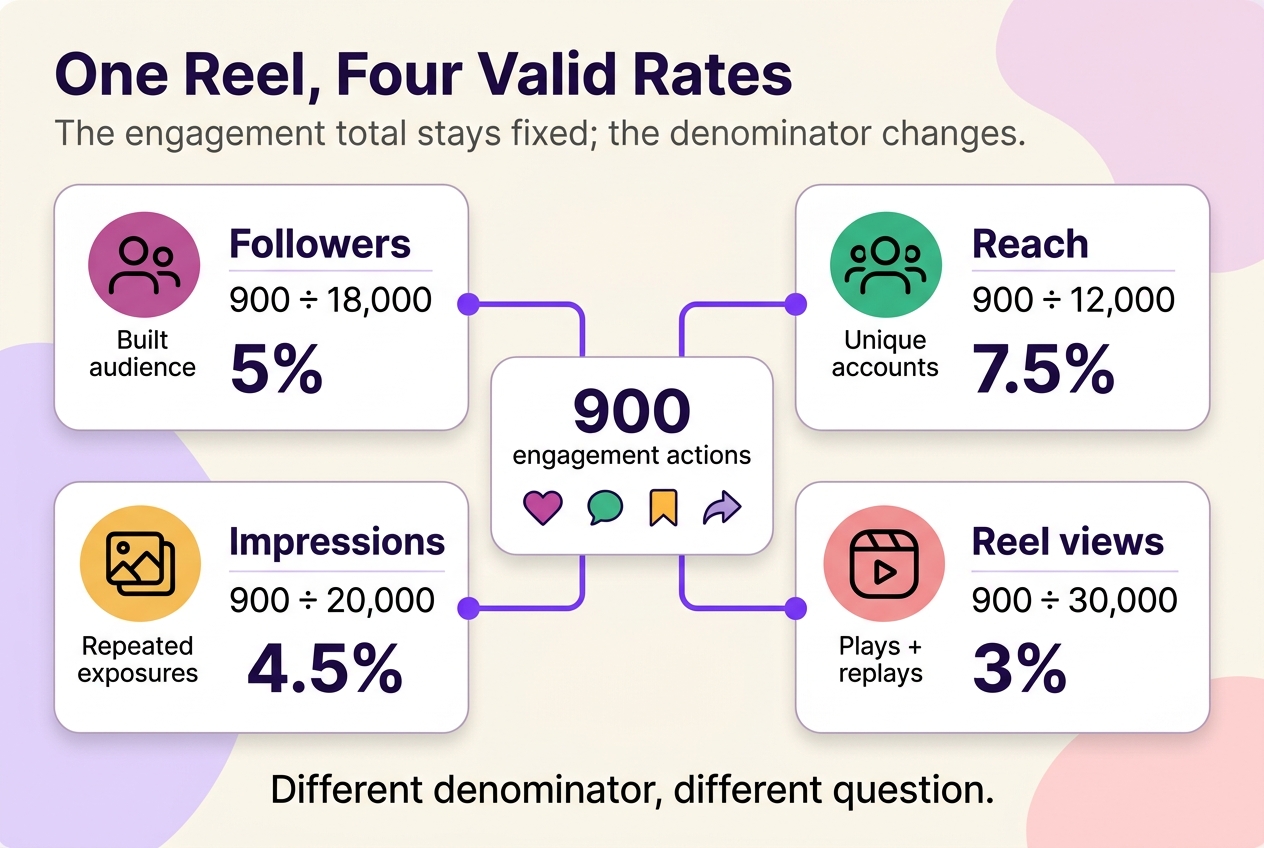
An engagement rate is comparable across posts only when its included actions and its denominator stay fixed. A reach-based engagement rate and a follower-based one are not the same measurement, and a report that swaps between them mid-comparison will make ordinary variation look like a real change. None of this requires a published benchmark to be useful; the comparison that matters most is a piece of content against your own account’s recent history under the same definition, not against a number another account reported under conditions you cannot verify.
Validate an analytics tool before you commit
The mistake that causes the most stakeholder disputes later is testing a new tool only in its clean demo workspace. A demo rarely surfaces the date-range mismatches, refresh delays, or historical-data gaps that show up once real reporting starts. Before committing budget or a contract term, connect the tool to a real account and check each of the following against a report you actually need to produce: account-connection eligibility — confirm what account type and settings the tool requires, since Meta’s own Business Suite, for example, requires the connected Instagram account to be a business or creator account, and other vendors set their own conditions; the specific permissions the connection requests; which metrics it actually surfaces versus which it only markets; how far back its historical data reaches; how it handles date ranges; whether it separates organic from paid activity or blends them; what it lets you export; how often it refreshes; and its current billing, trial, and cancellation terms as stated in its own documentation rather than remembered from a sales call.
Then run it through two real periods, not one: a historical stretch you can compare against records reviewed directly in native Insights for the same account and date range, and a live reporting cycle where you can watch how numbers move as new content publishes. A tool that reconciles cleanly against one past month but drifts during a live cycle is telling you something about its refresh behavior, not about your content. If a connection fails silently or a metric you expected is simply missing, that is a coverage gap to resolve before renewal, not after. If a tool’s access needs revoking, use Instagram’s third-party app controls to remove the connection; Instagram says removal stops the app from receiving new data.
Use competitor data as a hypothesis, not a target
The usual advice to “study what competitors post” breaks down the moment their visible results get treated as a target instead of a lead. A competitor’s high-performing Reel could be resting on paid support, an audience built over years, a creator partnership, or off-platform promotion — none of which shows up in what you can see publicly. The safer use of competitor data is to turn one observed pattern into a single testable question for your own account: does a shorter hook length change save rate for your audience specifically, tested against your own history, not against theirs. If a tool’s competitor figures are not clearly labeled as directly observed, estimated, or simply unavailable, treat the unlabeled numbers as a lead worth checking, not a fact worth reporting.
Choose the next measurement step that removes your bottleneck
Pick one branch and start there. If the open question is about content, open native Insights and start a decision log today. If it is about business return, configure tagged links and a defined conversion before the next campaign launches. If it is a recurring reporting or workflow gap, trial one tool against one real report before signing a contract term. The next useful analytics decision is the one with a name attached, not the eighth tool added to a stack.
 120,000+ creators say yes
 Real Active Accounts


 Username Generator
  Hashtag Generator
  Font Generator